The Fitbit Fiasco
The company launched a wellness program. Everyone got a shiny Fitbit to help them track their 10,000 steps. The goal: Employees who walk together. The dashboard shows leaderboards. Prizes await the winners.
Week one looks promising. Step counts soar. The C-suite celebrates.
By week three, the real creativity emerges: employees strap Fitbits to ceiling fans, shake them while watching Netflix, or simply hand them to their teenagers. The most “active” employee hasn’t left their desk in days.
The program measured movement, not health. It rewarded gaming, not genuine behavior change.
This isn’t employee dishonesty—it’s predictable human psychology in action
Why Do Humans Game Every System

Behavioral science reveals why the Fitbit failure was inevitable. When you create a metric, you create a game. And humans are exceptional at finding the path of least resistance to win that game—even when it defeats the original purpose.
Research on behavioral design shows three critical forces at work:
The Path of Least Resistance: People naturally gravitate toward the easiest way to achieve the measured outcome. If steps matter more than actual fitness, they’ll find creative ways to generate steps without walking.
Loss Aversion in Action: Employees feared falling behind on leaderboards more than they cared about personal health. The emotional pain of ranking poorly outweighed the long-term benefits of genuine wellness.
Social Proof Gone Wrong: When one person discovered the ceiling fan trick, others followed. The social norm shifted from “be healthy” to “be clever about gaming the system.”
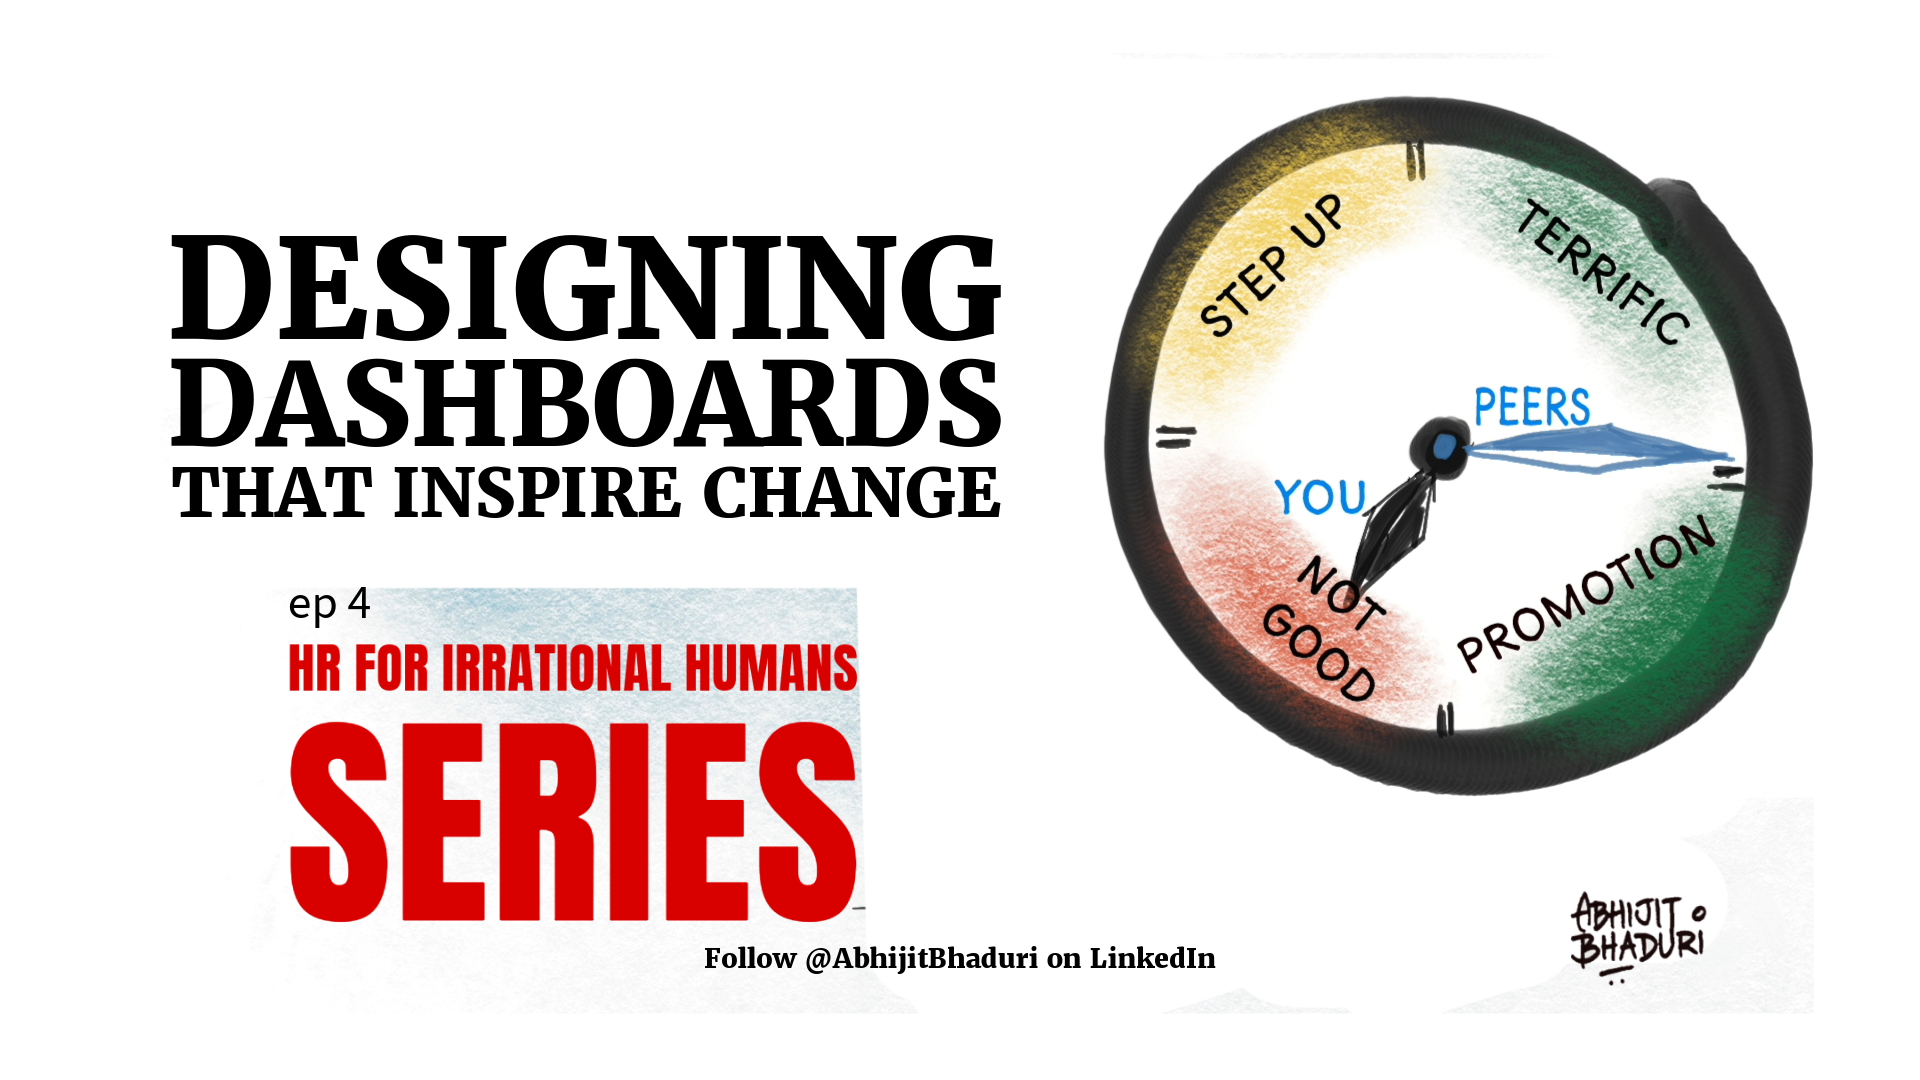
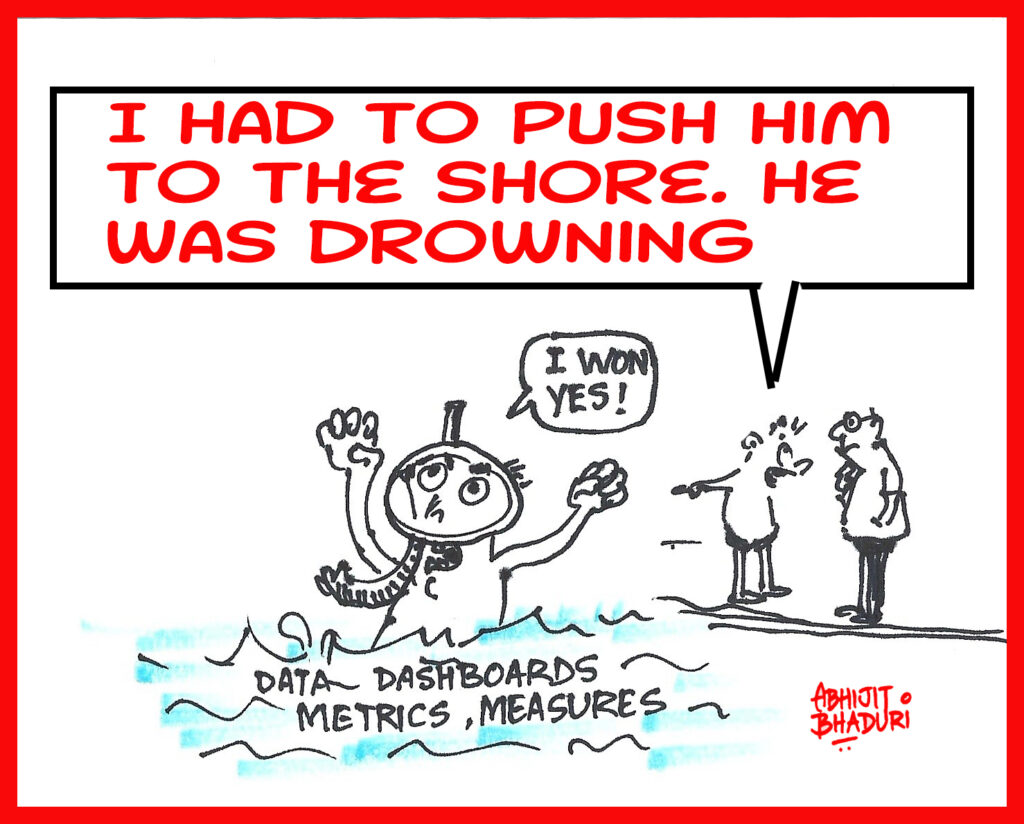
Do Dashboards Actually Drive Change?
Most performance dashboards fail for the same reason the Fitbit program did: they measure activity, not meaningful outcomes. They create what researchers call “metric fixation”—the mistaken belief that measuring something automatically improves it. The most motivating metric isn’t “100% achievement”—it’s “better than yesterday.” Small, consistent improvements trigger what psychologists call “progress principle”: the dopamine hit of forward momentum.
Show people their progress.
Dashboards are effective IF
- They focus on behaviors people can directly control
- They provide immediate, actionable feedback
- They align with intrinsic motivation rather than external competition
When Dashboards Backfire:
- They create arbitrary competitions between colleagues
- They measure outcomes people can’t directly influence
- They substitute measurement for actual support or coaching
When individual metrics matter most, teamwork suffers. People hoard information, avoid helping colleagues, and focus solely on personal rankings. People perform better when they’re competing together, not against each other. We design metrics that confirm what we already believe about performance rather than discovering what actually drives results.
Consider the difference between tracking “emails sent” versus “problems solved for customers.” The first creates busy work; the second drives meaningful impact.
Competition Can Kill Performance
Leaderboards seem motivating in theory. In practice, they often create what psychologists call “crowding out” effects—where external rewards diminish intrinsic motivation.
Social comparison can backfire in three predictable ways:
The Bottom-Third Effect: Employees who consistently rank in the bottom third often give up entirely rather than try harder. The leaderboard becomes demotivating, not inspiring.
The Gaming Escalation: As people discover ways to manipulate metrics, others must either join the gaming or fall behind. Soon, everyone is optimizing for the wrong things.
The solution isn’t to eliminate measurement—it’s to design it more thoughtfully.
Behavioral Biases That Break Performance Systems
Behavioral science reveals the uncomfortable truth: most performance metrics trigger our worst psychological instincts, not our best ones.
The Measurement Trap: When people know they’re being watched, they optimize for the metric, not the outcome. Psychologists call this “teaching to the test”—and it happens everywhere from call centers (shorter calls, not better service) to sales teams (more meetings, not better relationships).
The Leaderboard Illusion: Rankings create what researchers call “social comparison anxiety.” The bottom 50% feel demoralized and check out. The top performers become obsessed with maintaining position rather than improving the team. Everyone focuses on beating each other instead of beating the competition.
The Dashboard Paradox: More data doesn’t create more clarity—it creates more paralysis. When managers see 15 metrics flash red, they either ignore them all or chase the easiest one to fix, which is rarely the most important.
Designing Metrics for Hybrid Reality: A Behavioral Blueprint
The hybrid workplace demands a complete rethink of performance measurement. Remote work makes traditional metrics (time in office, meeting attendance) irrelevant, while creating new challenges around connection, collaboration, and output quality.
Step 1: Start with Behavior, Not Outcomes
Instead of measuring “customer satisfaction scores,” track “customer problems resolved within 24 hours”. Employees can control their response time; they can’t control every factor affecting satisfaction.
Step 2: Build in Emotional Relevance
Metrics should connect to what people already care about. Rather than tracking “training hours completed,” measure “new skills applied in real projects.” The second feels meaningful; the first feels like compliance.
Step 3: Design for Intrinsic Motivation
Replace leaderboards with personal progress tracking. Show individuals how they’re improving over time, not how they rank against colleagues. This builds confidence rather than competition anxiety.
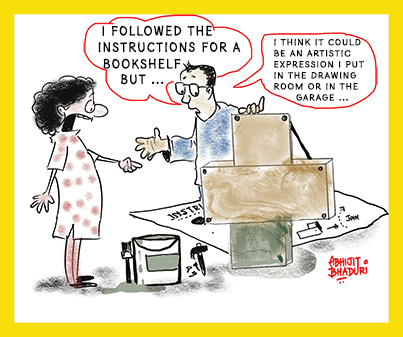
Step 4: Create Actionable Insights, Not Data Dumps
Each metric should answer the question: “What should I do differently next week? If the dashboard doesn’t suggest clear next steps, it’s just information theater.
Step 5: Test for Gaming Potential
Before launching any metric, ask: “How would someone clever try to manipulate this?” Then either redesign the metric or build in safeguards against gaming.
The Hybrid Performance Dashboard That Actually Works
Here’s what a behaviorally-informed performance system looks like in practice:
Personal Progress Panel: Shows individual improvement over time, not peer comparisons. Celebrates growth, not rankings.
Impact Stories: Highlights specific examples where someone’s work made a difference. Creates emotional connection to purpose, not just numbers.
Next Action Prompts: AI-powered suggestions for improvement based on patterns. Focuses on what to do, not what went wrong.
Team Collaboration Index: Measures helping behaviors and knowledge sharing. Rewards collective success, not individual competition.
Meaningful Milestones: Tracks progress toward personally-chosen goals. Aligns measurement with individual motivation.
The Real Metric That Matters: Do People Want to See Their Data?
The ultimate test of any performance system isn’t whether it provides accurate measurement—it’s whether people actively seek out their results.
When employees check dashboards voluntarily, you’ve created a tool for growth. When they avoid or ignore the data, you’ve created a system of judgment.
The difference isn’t in the technology—it’s in the behavioral design.
The future of performance management isn’t about better dashboards or smarter algorithms. It’s about creating systems that feel more like personal coaches and less like surveillance tools.
This means measuring what people can control, celebrating progress over perfection, and designing for intrinsic motivation rather than external pressure.
Because at the end of the day, the best metric is the one that helps people become the professional they want to be—not the one that catches them gaming the system.
Start there. Then build everything else around it.
Do you think, we need to create new measures for performance in the hybrid world? Have you designed such a dashboard?

Leave a Reply